This is a stub for version 1.0
Developer
Internal shortcut notes. Remember that in the first cell we have called MuJPy the instance that produces the GUI. Create a new cell under the GUI, with + in the top bar, to explore these functions, e.g.
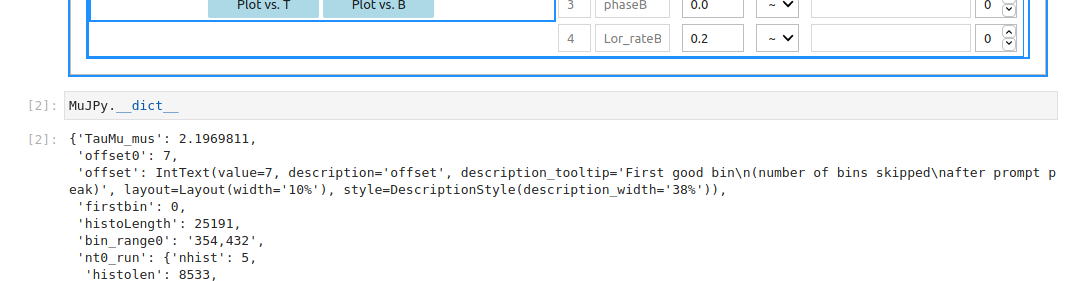
To run this extra cell, click on it and then click on the play button. You can modify and reclick. In this way you access all code’s self.xxxx methods and variables as MuJPy.xxxx
Fit
Three types: * single: one run * suite: several runs, in succession * global: not implemented in v. 1.0
- Fit starts with on_fit_request
- start, stop, pack are obtained by derange
- time, asymm, asyme are packed by rebin from the asymmetry loaded arrays
- self. _the_model_ is the instance of mucomponents that reproduces the model shown in the fit tab
- int2_int () recreates a list of methods, each one calculates the corresponding component in _the_model_ (apart from ‘da’, whose method is never invoked)
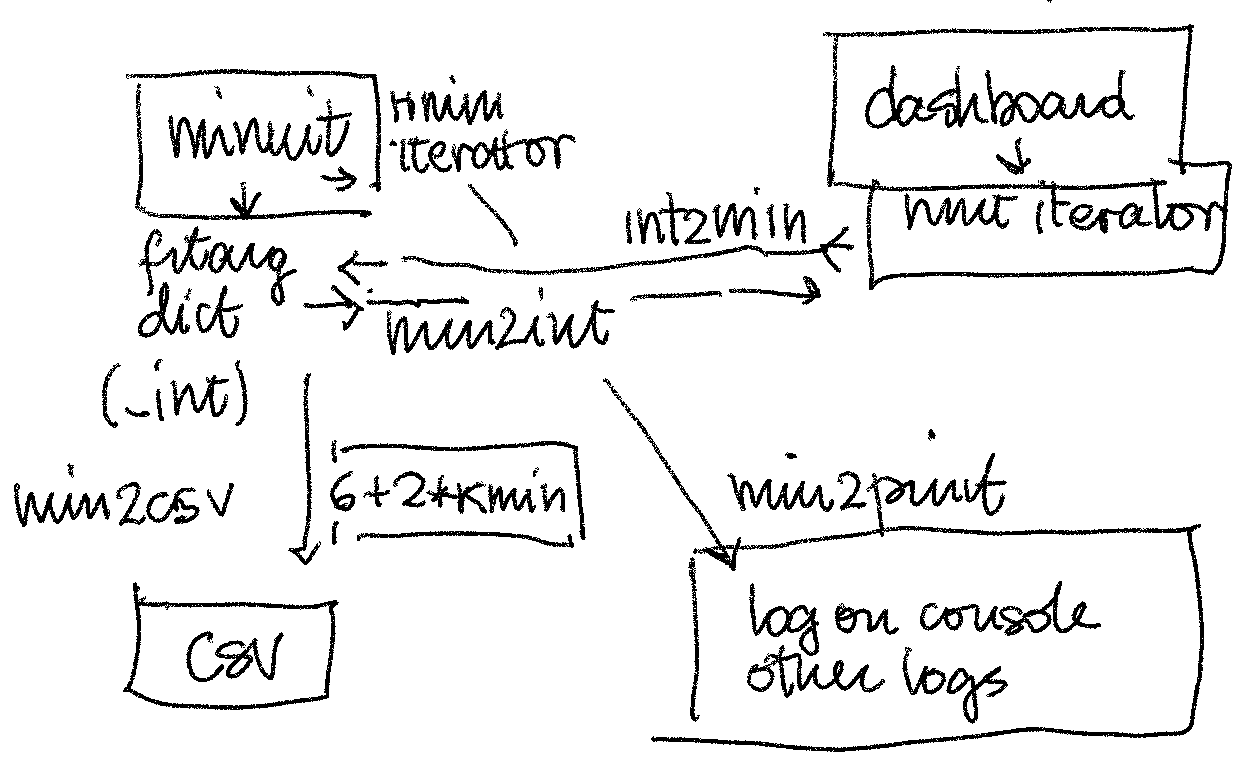
- int2min (return_names=True) recreates a list of dictionaries of parameter names, values, initial error and bounds, as required by iminuit.Minuit
- fitargs is the initial guess from the dashboard
- M is an instance of iminuit.Minuit, initialised as lastmin, and then run with lastmin.migrad()
- lastfit.fitargs() output the bestfit in the same list of dictionaries as produced by int2int
- min2print (lastfit.fitarg) prints on the console
- lastfit.fval calculates fcn (chi square non reduced)
- if lasffit is ok fitplot () produces both plots and files (a plot oriented csv, and a pickled fit that can be reloaded to reproduce everything)
_the_model_
instance of mucomponents reproducing, e.g. the template ‘daml’
asymmetry
builds asymmetry and error arrays according to groupings. Error evaluation with background subtraction follows musrfit.
chi
calculates chi2, see mucomponents
derange
see tools
fitargs
Standard output of iminuit as a dictionary. See <https://iminuit.readthedocs.io/en/stable>_ iminuit documentation
fitplot
start, stop, pack […] are obtained by derange, check if legal (version with two ranges, different packing)
self.`asymmetry`_() creates data with fixed self.`alpha`_
fitarg is the list of iminuit-ready dictionaries that define a model (loaded by int2min, one per run in a suite)
guess == True generates plot from dash parameters even before fit execution
pars is the parameter list
t,y,ey, asymmetry points and errors are rebinned according to start, stop, pack […] (just for plotting purpose)pars is used to create the array model function (for time array
tf) asf = np.array([self._the_model_._add_(tf,*pars[k]) for k in range(len(pars))])
this is done 3 [or 5] times :
tf, f, for the theory curve with unbinned datat,f, for residues with start, stop, pack binningtfit, ffit, for residues with fit_start, fit_stop, fit_pack binned datathe figure is fig,
ax =P.subplots((2,2)), with equally shaped ax [(2,3) if there are two packing ranges].(tries to reuse an existing one)
the plot is split up into two loops
- global (not implemented)
- non global, split up again into three cases
- anim for suites shwon as animations
- suites (no anim) uses plotile from `tools`_ to produce superposiion of plots
- single
let’s describe single as simplest example, it produces
- an errorbar(ttile,ytile,yerr=ey) with a fit plot(tftile,ftile) in ax[0,0] [idem if second range in ax[0,1]]
- a residue plot(ttile,yres) in ax[1,0] [idem if second range in ax[1,1]]
- a title
- chi2 for fit and for plot using chi that retrieves chi2 from mucomponents
- plots chi2 histogram in ax[1,-1]
- writes chi2 in ax[0,-1]
raises the window
int2_int
from dashboard to fitargs list of mucomponents methods, as in _the_model_; each requires input: a time array (or single value), and parameter values.
int2min
- list of dicts, e.g.::
- [{‘dalphaA’: 3.09e-321, ‘error_dalphaA’: 0.0,’limit_dalphaA’: None,’fix_dalphaA’: False, ‘asymmetryB’: 0.2,’error_asymmetryB’: 0.01,’limit_asymmetryB’: None,’fix_asymmetryB’: False, ‘fieldB’: 3.12,’error_fieldB’: 0.01,’limit_fieldB’: None,’fix_fieldB’: False, ‘phaseB’: 0.0,’error_phaseB’: 0.01,’limit_phaseB’: None,’fix_phaseB’: False, ‘Lor_rateB’: 0.2,’error_Lor_rateB’: 0.01,’limit_Lor_rateB’: None,’fix_Lor_rateB’: False}]
min2int
from minuit to dashboard
min2print
writes results on console
min2csv
function in plotpar . Translates from kmin to csv columns, as read by:
p = np.genfromtxt('file.csv',comments='R')
min2csv = lambda k: 2*k+6
on_fit_request
started by pressing the Fit button
plotpar
plots fit resuts vs T or B
mucomponents
a class dedicated to muon fit component functions, chi2 calculation and theirs services.
— tools — utilities